研究內容
Our project work towards high-quality superconducting qubits
Our project work towards high-quality superconducting qubits
Our ongoing project focuses on the development of a fully functional quantum computer, which has the potential to create a sustainable environment and foster advancements in fields such as artificial intelligence, drug discovery, and exotic material science. To ensure the success of this endeavor, reliability, robustness, and scalability are critical factors, which is why our project is primarily focused on superconducting quantum computers. With the use of current semiconductor technology, we can construct superconducting qubits, and precise fabrication techniques can enhance their lifetime. Moreover, we can predictably decrease the error rate of the superconducting qubits over time. Additionally, by employing 3D stacking architecture, we can achieve high-density packaging while still maintaining controllability.
I. Fabrication of Superconducting Qubits
I.1. One-step all electron beam lithography lift-off process
To facilitate a rapid qubit chip process, we adopted an all-electron-beam-lithography method to construct superconducting qubits via a one-step lift-off procedure. This approach integrates the application of photo-resist, electron beam exposure, development, metal deposition, and lift-off processes in a single step. Fig. I-1 illustrates SEM images of a fabricated device at various magnifications.
Figure I-1. SEM images of a 3-qubit device made by using a one-step all electron beam lithography lift-off process. Josephson junctions are made by commonly used tilt-angle evaporation technique, and the cross-section view is shown in the lower-right panel.
I.2. Junction resistance control
The frequency of the qubit is closely tied to the junction resistance at room temperature, which is primarily controlled by the thickness and quality of the AlOx barrier. The variability in the Josephson junctions' resistance was determined by conducting measurements, as depicted in Fig. I-2, which displays an 8% deviation.
Figure I-2. Junction resistance control. This is performed on a chip containing 24 test junctions.
I.3. Wire bonds as airbridges
Efficient entanglement and control of superconducting (SC) qubits necessitate strong electromagnetic interactions, which can be impeded by undesired couplings, such as z-gate crosstalk. To eliminate these couplings, constructing airbridges is a viable solution. This technique suppresses slot-line modes and directs return currents by wire-bonding Al-wires that connect the two ground planes on the two sides of CPW structures.
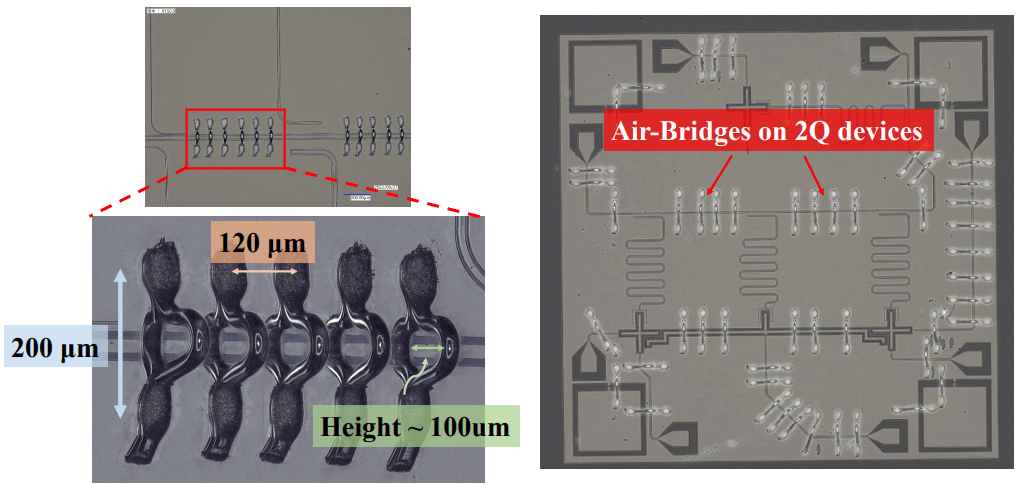
Figure I-3. Wire bonds as air-bridges across CPW structures.
I.4. Efforts towards the improvement of the resonator internal quality factor
In the quantum regime, coupling between qubits and two-level systems (TLSs) is a major concern since it is this coupling that contributes to decoherence. TLS defects are mainly located at the metallic surface, substrate surface, and metal/substrate interface. Our resonator fabrication strategy includes three steps.
1. Preparation of high-quality coplanar waveguide (CPW) resonators
The first step in preparing high-quality coplanar waveguide (CPW) resonators is to clean the substrate surface before metal deposition. It is essential to remove the native oxide in the substrate before metal deposition to avoid RF loss. In Fig. I-4, TEM images and EDX-mapping of Si/Al interface show that Si is preliminarily cleaned using the Piranha solution and diluted HF. The growth of Al films is also controlled to prevent atomic inter-diffusion, which can occur in the case of high process temperature.
The second step is to define the resonators. Current resonator fabrication schemes use subtractive fabrication processes to guarantee a clean metal/substrate interface. In Fig. I-5, SEM images display Al and Nb CPW resonators that were etched using wet- and dry-etching methods, respectively.
The third step involves removing native oxides on both the substrate and metal surfaces before measurement. A post-acid cleaning process can be utilized to reduce dielectric loss by removing the native surface oxides on metal and substrate. SEM images of devices before and after the post-clean treatment are presented in Fig. I-6.
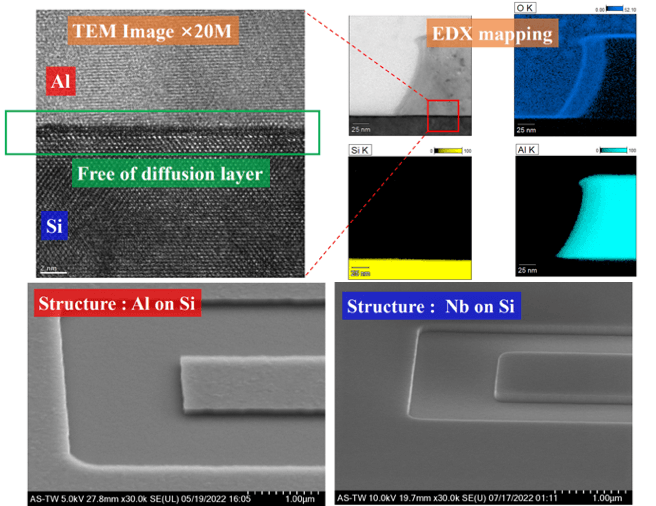
Figure I-4. TEM analysis of the substrate/metal interface and metal surface.
Figure I-5. Images of resonators after subtractive processes
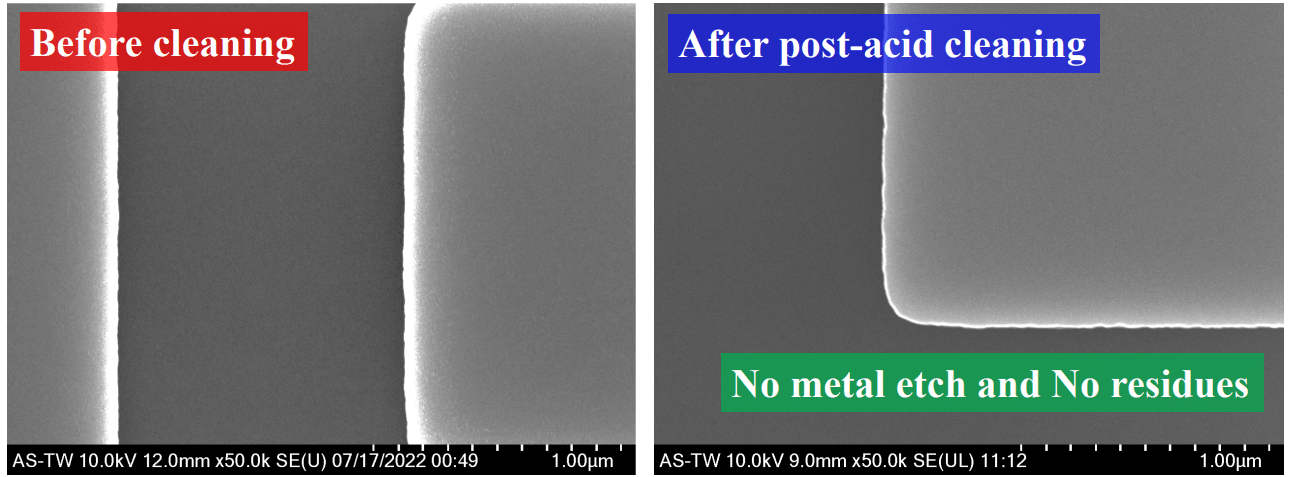
Figure I-6. Images of the resonators after post-cleaning.
I.5. A study on MBE-grown Al-AlOx-Al structure on sapphire
A partnership with Prof. Shangjr Gwo from the Department of Physics at NTHU enabled the growth of a single-crystalline Al-AlOx-Al structure on sapphire through the use of an MBE system. TEM images of the samples are presented in Fig. I-7, with Al and AlOx thicknesses of 10nm and 0.8nm, respectively. The atomically sharp interfaces provide a more precise resistance range for Josephson junctions, reducing the risks associated with electrical micro-shorts and TLS in amorphous AlOx. This also provides an ideal platform for resonators and qubits.
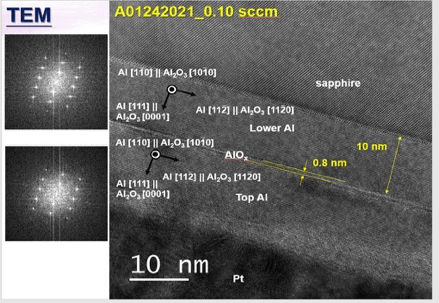
Figure I-7. TEM images of MBE grown Al-AlOx-Al structure on c-Sapphire. The atomically sharp interfaces at the interfaces and electron diffraction pattern suggest single crystalline Al films on sapphire substrate and on top of AlOx thin layer.
II. Qubit Characterization
Cavity quantum electrodynamics (QED) utilizes two main readout techniques: dispersive readout and Jaynes-Cummings (JC) readout. Dispersive readout relies on the change of the cavity resonance based on the qubit state, and the qubit state can be inferred by measuring the reflection or transmission signal of the cavity. In contrast, JC readout works in the high-power regime, where the shifted moves towards the bare cavity frequency due to a nonlinear effect of a highly driven cavity-qubit coupled system. The output signal of JC readout is dependent on the qubit state, and the high input level improves the signal-to-noise ratio (SNR). Beyond these basic measurement techniques, more complex measurements are performed to elucidate the qubit properties. For instance, the two-tone measurement scheme is used to detect the qubit frequency. In this scheme, a qubit driving tone is applied on the XY-gate, and a cavity readout tone at the cavity frequency is simultaneously applied on the feedline. The cavity signal will be distinct from its background at .
II.1. Rabi Oscillation measurement
With a calibrated , Rabi oscillation measurements can be performed. In this measurement, the qubit's population is measured after driving the qubit at on the XY-gate for a certain duration. As shown in Fig. II-1, a discernible Rabi oscillation is observed up to a detuned driving frequency of 15 MHz. The green vertical dashed line indicates the , where the Rabi oscillation amplitude is highest. The length of the pulse needed to excite the qubit from its ground state and vice versa can now be determined and is half the Rabi oscillation.
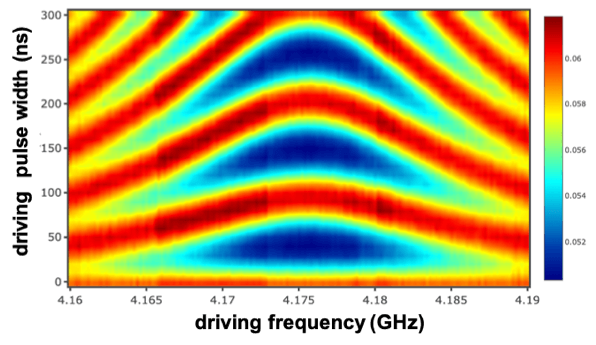
Figure II-1. Rabi oscillation with different qubit-XY driving detuning.
II.2. T1 time measurement
In a standard picture of systems, there are two characteristic decay rates that contribute to coherence loss. The first one is the longitudinal relaxation rate (or energy decay rate) , which characterizes the time it takes for the qubit to exchange energy with its environment. The second one is the transverse relaxation rate (or decoherence rate) , which characterizes the time it takes for the qubit to remain phase coherent. T2 is related to both pure dephasing time and T1, which are related to the environmental noise as seen by the qubit. Fig. II-2 shows the pulse scheme of the T1 measurement, in which a pulse is first applied to the qubit to excite it. Then the qubit population is measured after a varied idling time of the qubit (readout delay time).
When discussing systems, two types of decay rates contribute to coherence loss in a standard picture. The first is the longitudinal relaxation rate, also known as the energy decay rate , which indicates how long it takes for the qubit to exchange energy with its environment. The second is the transverse relaxation rate, also known as the decoherence rate , which indicates how long the qubit remains phase coherent. T2 is related to both pure dephasing time and T1, which are associated with the environmental noise as observed by the qubit. Figure II-2 illustrates the pulse scheme used in T1 measurements. In this scheme, a π pulse is first applied to the qubit to excite it, followed by measuring the qubit population after varying the idling time (readout delay time) of the qubit.
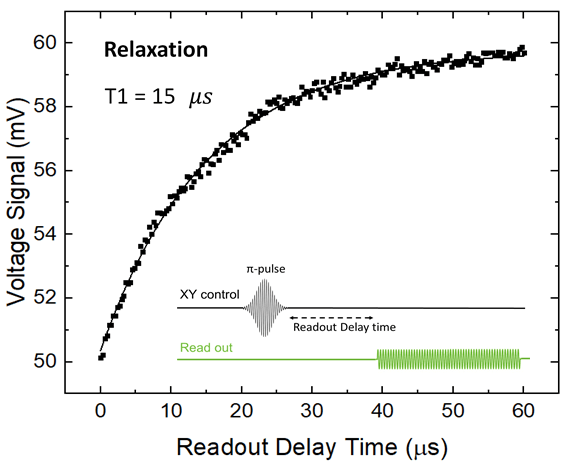
Figure II-2. Measurement of qubit's T1 time.
II.3. Measurement of Ramsey Fringes and T2 time
As explained earlier, T2 time is the duration when the qubit remains at its relative phase between the and states. Fig. II-3a shows the pulse scheme of the T2 measurement, wherein a pulse is first applied to the qubit to bring the qubit from to (on the equator of the Block sphere). Then the qubit is made idle for a varied amount of time when the phase decay corresponds to the decay of the XY-plane component of the state vector. This decay is finally rotated to the z-axis of the Block sphere after the second pulse to enable a dispersive readout. The Ramsey fringe shown in Fig. II-3b is obtained using the pulse scheme shown in Fig. II-3a but done with varied detuning driving frequencies. Shown in Fig. II-3c is the measured T2* time without dynamical decoupling. It is important to note that when the detuning is zero, a decay without oscillation is measured as indicated by the white dashed vertical line in Fig. II-3b, which provides a method for precise determination of the qubit frequency.
As previously mentioned, the T2 time is the length of time that the qubit remains at a relative phase between the and states. Figure II-3a depicts the pulse scheme utilized in the T2 measurement process. Initially, a pulse is applied to bring the qubit from the to state (on the equator of the Block sphere). The qubit is then left idle for a variable duration, during which the phase decay corresponds to the decay of the XY-plane component of the state vector. The decay is ultimately rotated to the z-axis of the Block sphere using the second pulse to enable a dispersive readout. The Ramsey fringe shown in Figure II-3b is obtained using the same pulse scheme as Figure II-3a but with varying detuning driving frequencies. Figure II-3c depicts the measured T2* time without dynamical decoupling. It is worth noting that when the detuning is zero, a decay without oscillation is measured, as indicated by the white dashed vertical line in Figure II-3b. This provides a precise method for determining the qubit frequency.
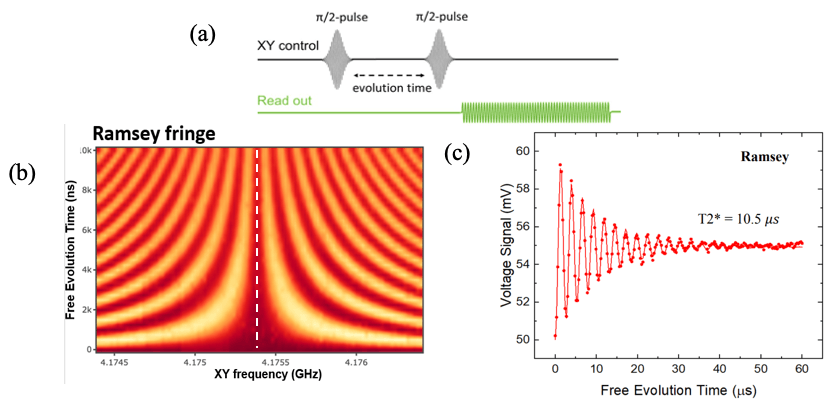
Fig. II-3 (a) Driving and readout pulses for T2 time measurement. (b) Ramsey fringes show that the X-mon qubit acts as a precise artificial atomic clock: Y-axis period is the exact inverse of X-axis detuning while X-axis period is the exact inverse of Y-axis. (c) Measured T2* time.
II.4. Dynamical Decoupling
To enhance the T2 time, dynamical decoupling is utilized, which is a noise reduction technique based on the spin echo method, as depicted in Figure II-4a. We implemented the Carr-Purcell-Meiboom-Gill (CPMG) pulse scheme for dynamical decoupling, which increases the temporal density of the echo pulses π, as shown in Figure II-4b. As illustrated in Figure II-4c, T2 time increases as the temporal density of the echo pulses increases. Additionally, since dynamical decoupling effectively mitigates pure dephasing, the qubit's T2 remains similar with different flux filling factors F. It is important to note that the strength of pure dephasing increases as the flux filling factors F increase.
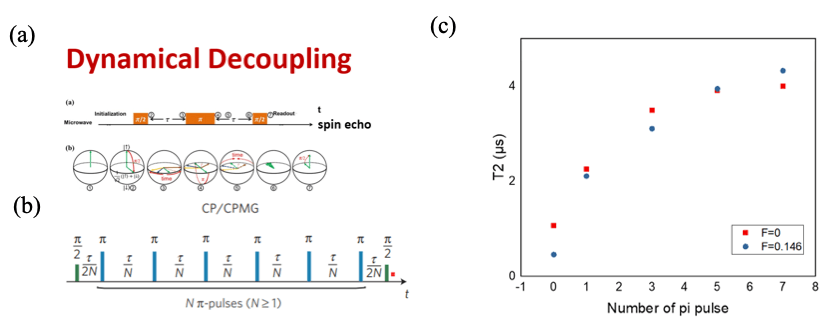
Fig. II-4. Measurement of T2 time by using dynamical decoupling technique. The technique is illustrated in (a) and (b), and (c) shows that the extract T2 time.
II.5. Quantum State Tomography
It is impossible to distinguish the superposed states through a single measurement in quantum mechanics, as measurements only provide the projection of the state onto a set of basis states. To reconstruct a quantum state, quantum tomography can be applied. By using tomographically complete measurements, such as the Pauli matrices , , and for a pure qubit state, the quantum state can be reconstructed. The readout resonator's dispersive shift can be used to perform the measurement, while the and measurements can be performed by applying a rotation about the -Y (X) axis before the measurement. These rotations can be extended to any angle about any rotation axis on the XY plane to evaluate the fidelity of the rotation operations. The proposed tomography can be conducted in three stages: state preparation, state rotation, and state readout. In the experiment, gating pulses in the I and Q channels can be used to apply rotations about the X and Y axes, respectively. By synchronizing the pulses and tuning their amplitudes, rotations about any axis can be obtained on demand. When the state is initially prepared in the ground state , a rotation about any axis on the XY plane changes the state to the excited state . Thus, the measurement results will produce a concentric structure with a ground state probability = 1 at the center, as shown in Figure II-5a. If the state is prepared as a superposed state "X" ("-Y"), no change of the state will be produced by a rotation about the X-axis (Y-axis), resulting in a nodal line of = 0.5 in the measurement outcome. However, a rotation about the Y (X) axis will produce an oscillation in .
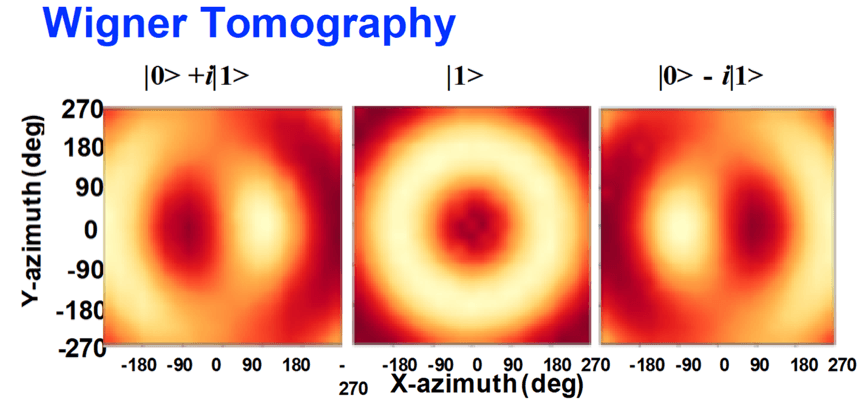
Figure II-5. Wigner (Fluorescence) Tomography showing the X-mon being manipulated into states (from left) , and on the Bloch sphere, corresponding to , and rotations along the X-axis.
II.6. Randomized benchmarking of single-qubit gates
The quantum computer's performance is measured by gate fidelity, and one experimental method for determining the errors of quantum gates is randomized benchmarking (RB). In our study, we conducted a Clifford-based RB experiment to showcase our ability to control quantum systems and calculate the average errors of single-qubit gates and Clifford elements. It's worth noting that the Pauli group, including Clifford elements, can be generated from the Pauli group itself. The outcome of the RB experiment is displayed in Fig. II-6, revealing that the average error rate for Clifford elements is 0.79%, leading to an average single-qubit error rate of 0.42%. The corresponding fidelities can be easily obtained by calculating 1-r.
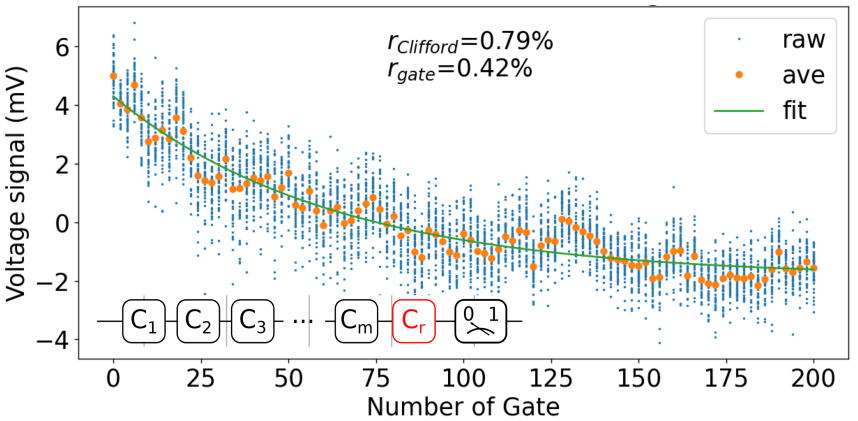
Figure II-6. Error rates retrieved from Clifford-based Randomized Benchmarking.
III. Two-qubit (2Q) system
III.1. Design for the two-qubit coupling scheme with the tunable coupler
In order to showcase the coupling between two qubits, we employed a tunable coupler design that utilizes a frequency-tunable coupler transmon (Qc) to connect to both qubit 1 (Q1) and qubit 2 (Q2), thereby creating an indirect Q1-Q2 coupling gindir. The equivalent circuit for this design is illustrated in Fig. III.1a, with gindir expressed as . The total Q1-Q2 coupling is given by gtot, which is the sum of gindir and gdir - the direct coupling strength arising from the direct capacitive coupling associated with C1c, C2c, and C12. The tunability of this design allows for the adjustment of gtot to tens of MHz and can be turned off completely through the cancellation of indirect-direct coupling (gindir = -gdir). The SEM image of the 2Q chip, which includes all transmons (Q1, Q2, Qc) with their respective readout resonators and flux bias lines (Z lines), as well as RF control lines (XY lines) for XY rotations of qubits for Q1 and Q2, is presented in Fig. III.1b.
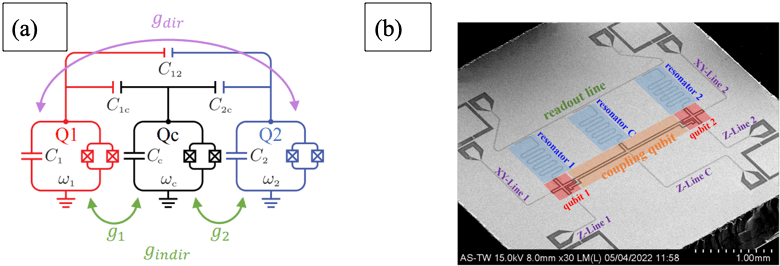
Figure III.1. a. Equivalent circuit of the 2-qubit coupling design with the tunable coupler. b. SEM image of the 2Q chip.
III.2. iSWAP gate
We have demonstrated the state-swap process between two interconnected qubits, which is an important step in enabling 2Q gate operations. Since two-qubit gates are fundamental to building a universal quantum computer, this task is noteworthy. Fig. III.2a depicts the design of the 2Q circuit with a tunable coupling qubit Qc, while Fig. III.2b shows the operation scheme. Initially, brought to the excited state using a -pulse. During the idle period, the Z gate for Q1 (Z1) is set to a value that detunes it from Q2 to separate them. During the swap process, Z1 is switched to Q2, allowing the two qubits to become coupled. As depicted in Fig. III.2c, the coupling permits Q1 and Q2 to exchange their states at a frequency that corresponds to the Q1-Q2 coupling strength. State readout can be done on either Q1 or Q2, and the results should demonstrate opposite states. Fig. III.2d illustrates the swap with respect to Q1-Q2 detuning, with the x-axis indicating the flux on Q1 used to adjust Q1's frequency.
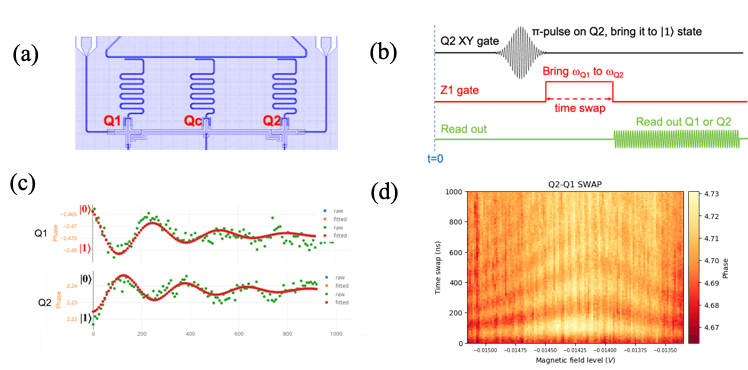
Figure III.2. State swap between two coupled qubits
III.3. CZ gate
CZ gate was tuned up by bringing Q11-2 into resonance with Q20-1 as shown in figure III.3(b). The coherent exchange of energy between Q11-2 and Q20-1 was observed in correlated Rabi oscillations of both Q1 (fig. III.3c) and Q2 (fig. III.3d), where |20> and |11> would oscillate periodically, after both of them were prepared in |1> state initially by first applying an X gate on Q1 and Q2 simultaneously (fig. III.3a). The CZ1 gate is where t11-20 had spanned the first full cycle and ZQ1 at the center of the crossover (fig. III.3d). Note that both states of Q1 and Q2 were prepared and readout at their chosen ZQ1,Idle indicated by a dashed red-line as shown collaboratively in figure III.3(a) and (b). The a-bit-skewed observed Chevron is caused by the Z-pulse distortion after travelling down a long way into the fridge, as it is consistent with the necessarily higher Z-pulse amplitude than its corresponding idle counterpart of |11>-|20> crossover, as indicated by cyan dashed arrow. The |11>-|20> crossover can always be found when both Qubits’ 0-1 transition differs by an anharmonicity, EC (fig. III.3(b)).
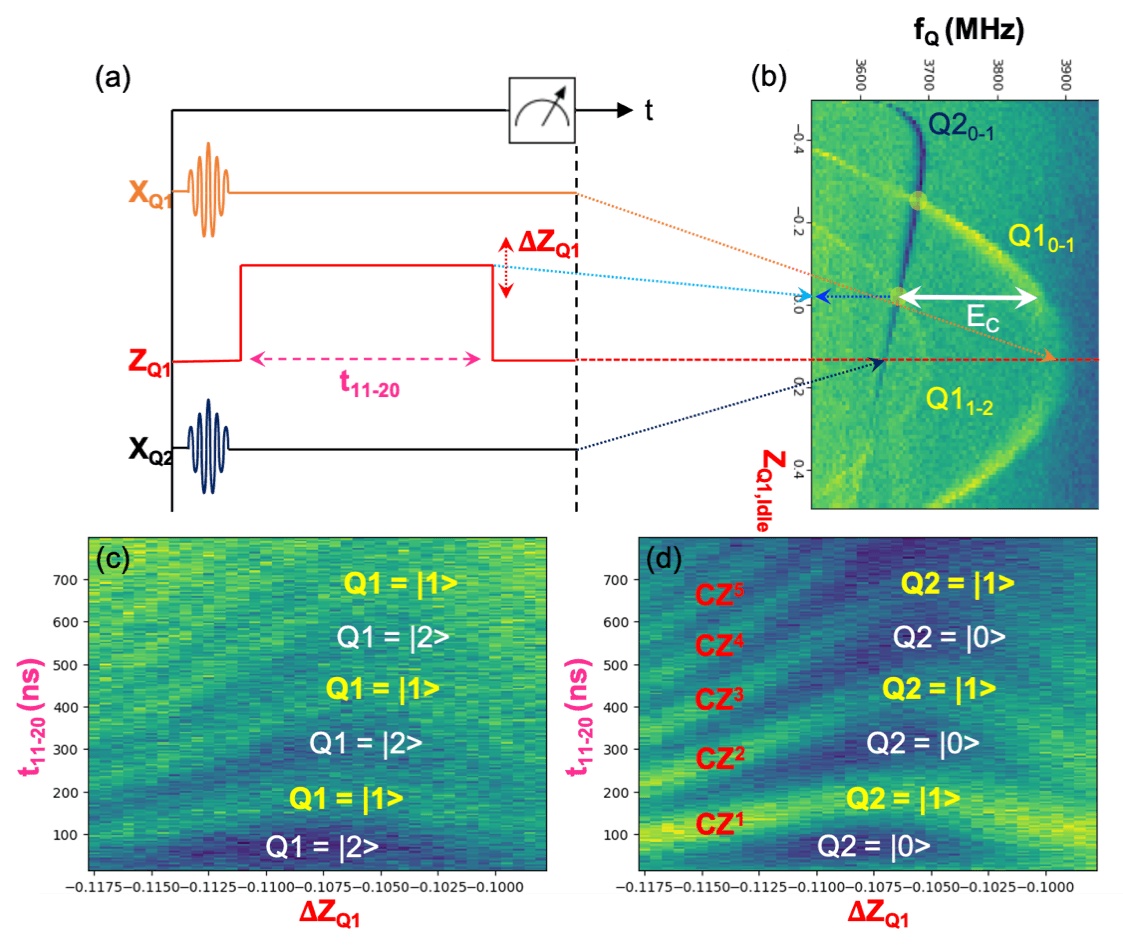
Fig. III.3. CZ tune-up. (a) The pulse orchestration scheme and multiplexed readout on both Qubits. (b) For simplicity, both Qubits’ spectroscopy was driven by a constant (idle) ZQ1. The crossover between Q11-2 and Q20-1 can thus be found. (c-d) The correlated Rabi Chevron of |11>-|20> energy exchange will give us the approximate CZ-operation parameters. The measurements were all being carried out by Quantum Machine’s OPX+.
IV. Other noteworthy experiments
IV.1. Single-shot readout with the TPWA
The single readout pulse technique (single-shot readout) is used for qubit readout that requires the total readout time shorter than the qubit T1 time and the power is low enough to prevent spurious high-level transitions. Here, we utilize a Traveling Wave Parameter Amplifier (TWPA) into readout routings to improve signal-to-noise ratio (SNR), which is calculated by . The single-shot measurement results on the I-Q plane is shown in Fig. IV.1a. The readout performance is evaluated by the readout fidelity given by , in which is the probability of getting the measurement result interpreted as state given the qubit is prepared in . It is clear that a better SNR will lower and , leading to a better fidelity. The comparison between TWPA-on and -off cases are shown in Fig. IV.1b, where SNR of the TWPA-on case is better than that of the TWPA-off case.

Figure IV.1. Single-shot readout with and without the TWPA
2. Coplanar waveguide (CPW) resonators characterization and qubit survival
The technique of Quantum non-demolition (QND) measurement allows for highly accurate readouts of superconducting qubits coupled to CPW resonators in the dispersive limit. The loss of the resonator strongly affects the dissipation of the qubit state, which is why high-quality factor (Q) resonators are required. Additionally, the intrinsic Q factor's dependence on photon number can provide feedback to finely tune fabrication parameters. Our transmission measurement S21 of the resonators is shown in Figs. IV.2a and IV.2b, displaying the amplitude/phase and corresponding I-Q data, respectively. The experimental data are represented by points, while the fit is represented by solid curves. Fig. IV.2c illustrates the photon-dependent quality factors extracted from our resonators.
We also conducted a punch-out experiment to confirm the qubit's survival. This is a one-tone measurement that observes the power dependence of the cavity transmission, with the qubit frequency designed to be far-detuned from the cavity frequency. The high-power resonance feature indicates the bare cavity frequency, while the low-power resonance feature shows the dispersive shifted cavity if the qubit survives and interacts with the cavity.
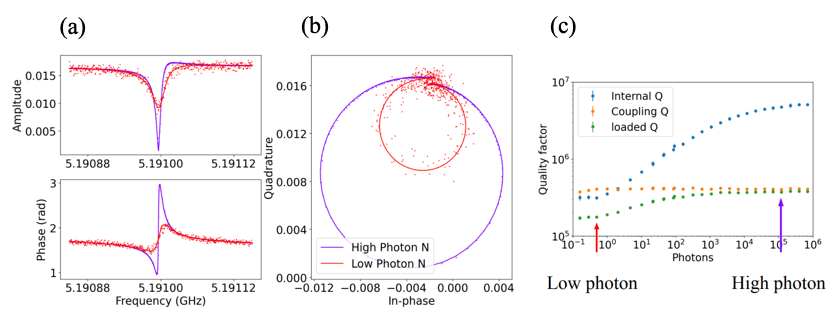
Figure IV.2. (a) Amplitude/phase of transmission measurement (S21) of the resonators. (b) I-Q data of the S21. (c) Extracted photon-dependent quality factors of the resonators.
TOP